
Version 4.2 of syslog-ng introduced a healthcheck option to syslog-ng-ctl. It prints three syslog-ng-related metrics on screen – if it can reach syslog-ng, that is. You can use it from scripts to monitor the health of syslog-ng.
Before you begin
The healthcheck option was added to syslog-ng-ctl in version 4.2. You need this or a later syslog-ng version to use this option. It is already available in the most recent Linux distributions. If you use an LTS Linux distribution, then check https://syslog-ng.org/3rd-party-binaries/ for 3rd party repositories for your OS.
If you want to send latency values printed by syslog-ng-ctl to Elasticsearch, you also need the jo utility: https://github.com/jpmens/jo This is available in several Linux distributions.
Testing from the command line
You can start syslog-ng-ctl from the command line or use it in your scripts. The -h option prints some help text on the terminal:
~# syslog-ng-ctl healthcheck --help
Usage:
  syslog-ng-ctl [OPTION…] syslog-ng-ctl

Health check

Help Options:
  -h, --help                 Show help options

Application Options:
  -t, --timeout              maximum seconds to wait for healthcheck results (default: 15)
  -c, --control=<socket>     syslog-ng control socket
This command line starts the health check with a five-second timeout. However, in my tests, the latency values stayed under one millisecond even during heavy load:
~# syslog-ng-ctl healthcheck -t 5
syslogng_io_worker_latency_seconds 0.000198092
syslogng_mainloop_io_worker_roundtrip_latency_seconds 0.00024865599999999999
syslogng_internal_events_queue_usage_ratio 0
I tried to disable syslog-ng for a test, but I could not test the timeout feature this way, as syslog-ng-ctl detected that there is something wrong at the other end:
~# systemctl stop syslog-ng
~# syslog-ng-ctl healthcheck -t 5
Error connecting control socket, socket='/var/lib/syslog-ng/syslog-ng.ctl', error='Connection refused'
Sending values to Elasticsearch
I wanted to see how the latency values printed by syslog-ng-ctl change over time. To check this, I created a cron job to run syslog-ng-ctl once a minute, and configured syslog-ng to send the results to Elasticsearch. The output of syslog-ng-ctl cannot be directly pushed to syslog-ng. However, using jo, you can turn the output of syslog-ng-ctl into JSON format. Syslog-ng can parse that and forward it to Elasticsearch.
~# cat health.sh
#!/bin/bash
/usr/sbin/syslog-ng-ctl healthcheck | sed 's/ /=/' |  jo | nc 127.0.0.1 514
The sed rule turns the output of syslog-ng-ctl into the format expected by jo. The nc command forwards the results to syslog-ng, listening on port 514 on localhost.
You should append the following configuration snippet to syslog-ng.conf or – if your configuration supports it – store in a new .conf file under the /etc/syslog-ng/conf.d/ directory.
source s_health {
    tcp(ip(127.0.0.1) port(514) flags(no-parse));
};

parser p_json_health {
    json-parser (prefix("health."));
};

destination d_json_health {
    file("/var/log/health.json"
        template("$(format-json --scope nv-pairs)\n"));
};

destination d_elastic_health {
    elasticsearch-http(
        index("snghealth")
        type("")
        url("http://localhost:9200/_bulk")
        template("$(format-json --scope rfc5424 --scope dot-nv-pairs
        --rekey .* --shift 1 --scope nv-pairs
        --exclude DATE @timestamp=${ISODATE})")
        persist-name("mylittlepony")
    );
};

log {
  source(s_health);
  parser(p_json_health);
  destination(d_json_health);
  destination(d_elastic_health);
};
So, what does the above configuration do? The source is listening for a TCP connection and does not parse the incoming message. The reason is that the tcp() source uses an RFC3164 parser by default, but we collect JSON-formatted messages. The next step is that a JSON parser parses the message and turns it into name-value pairs. We have two destinations: a JSON-formatted text file, and Elasticsearch.
Here, we depend on type support, which was introduced in syslog-ng 4.0. The jo utility generates JSON from the syslog-ng-ctl output with proper type support. When version 3.X of syslog-ng parsed it, numbers were turned into strings. With version 4.0 and later, the type information is preserved. You can forward the parsed name-value pairs without any further preparation to Elasticsearch, and they will be stored with the correct type in the database.
Testing
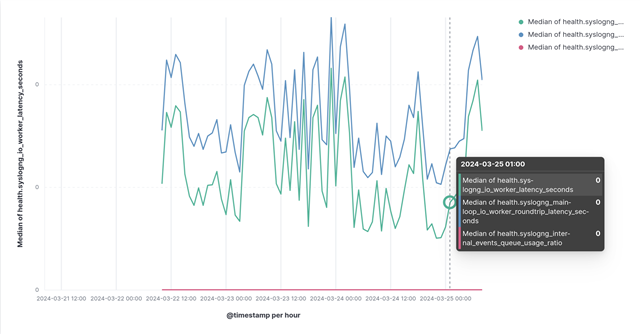
Once you reloaded the syslog-ng configuration, you should test it. First, just start the script from the command line and check the Elasticsearch web interface for messages in the snghealth database. If everything works as expected, you should put the script in cron, so it runs regularly. Soon, you should be able to visualize the syslog-ng health data. In my case, latency stayed under one millisecond even under heavy load:
What is next?
In my test environment, I could not overload syslog-ng and increase latency. However, in a larger production environment, you might create alerts based on latency values, or if syslog-ng times out on health checks. If running Kubernetes, you could base liveness probes on this as well.
-
If you have questions or comments related to syslog-ng, do not hesitate to contact us. You can reach us by email or even chat with us. For a list of possibilities, check our GitHub page under the “Community” section at https://github.com/syslog-ng/syslog-ng. On Twitter, I am available as @PCzanik, on Mastodon as @Pczanik@fosstodon.org.