

Prometheus is an open-source monitoring system that collects metrics from your hosts and applications, allowing you to visualize and alert on them. The syslog-ng Prometheus exporter allows you to export syslog-ng statistics, so that Prometheus can collect it.
While an implementation in Go has been available for years on GitHub (for more information, see this blog entry), that solution uses the old syslog-ng statistics interface. And while that Go-based implementation still works, syslog-ng 4.1 introduced a new interface that provides not just more information than the previous statistics interface, but does so in a Prometheus-friendly format. The information available through the new interface has been growing ever since.
The syslog-ng Prometheus exporter is implemented in Python. It also uses the new statistics interface, making new fields automatically available when added.
Requirements
Before you configure and start using the syslog-ng Prometheus exporter, make sure that the following prerequisites are met:
-
Python 3.x (tested with Python 3.6 and 3.11) with no external dependencies.
-
syslog-ng OSE 4.1 or later (tested with 4.7), or syslog-ng PE 7.0.32 or later (tested with 7.0.34).
For Docker testing, we used the official syslog-ng Docker image. Other images might use different path names for the syslog-ng control socket.
From the script's point of view, there is no difference between syslog-ng OSE and syslog-ng PE, except for the path of the syslog-ng.ctl (syslog-ng control socket) file.
How the syslog-ng Prometheus exporter works
The syslog-ng Prometheus exporter runs continuously in the background. It opens the syslog-ng control socket (its location depending on the operating system used) to collect statistics. It also starts a web server, where it shares the collected statistics. The amount and type of data collected by the exporter depends on the stats-level() setting of syslog-ng.
When Prometheus contacts the exporter, the exporter collects the latest stats from syslog-ng by sending a “STATS PROMETHEUS” command (or a “STATS PROMETHEUS WITH_LEGACY” command with the --stats-with-legacy parameter) to the socket. Then, it shares the results using the web server. You can get the same results on the command line with syslog-ng-ctl:
syslog-ng-ctl stats prometheus
Alternatively, if also using legacy metrics, run:
syslog-ng-ctl stats prometheus --with-legacy-metrics
Configuring Prometheus
Add a section similar to the following to your Prometheus configuration:
  - job_name: sng
    # syslog-ng on Alma Linux.
    static_configs:
      - targets: ['172.16.167.170:9577']
Change the various parameters according to your local environment. Then, reload Prometheus for the configuration to take effect.
Configuring the exporter
You can download the exporter using git:
git clone https://github.com/czanik/sngexporter/
Regardless of the use case, always make sure that the syslog-ng Prometheus exporter has access to the syslog-ng control socket. If the location is different from the default location (/var/lib/syslog-ng/syslog-ng.ctl), configure it accordingly with the ```--socket-path``` parameter.
For example, on an openSUSE system, you can start the exporter with the following command:
python sng_exporter.py --socket-path /run/syslog-ng
The ```--help``` option describes you the rest of the possible parameters. For example, you can bind the exporter to a specific IP address, a different port, and so on.
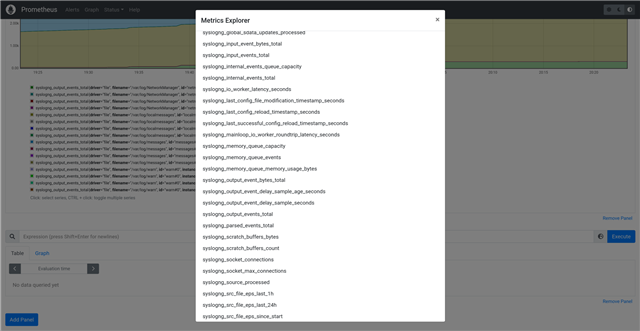
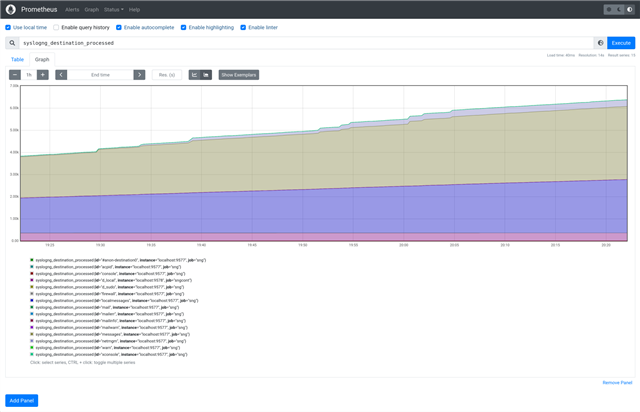
Checking the GUI
Once data from syslog-ng shows up in the Prometheus web GUI, you can choose what to visualize from a long list of monitored syslog-ng parameters:
What is next?
You can learn more about the syslog-ng Prometheus exporter from the README at https://github.com/czanik/sngexporter/?tab=readme-ov-file#readme, which also shows you a systemd service file and a Dockerfile to build a container from the exporter. It also describes a number of container-related use cases. It is also worth connecting Prometheus with Grafana, as it provides you with dashboards and a lot more flexible set of graphs, like this:
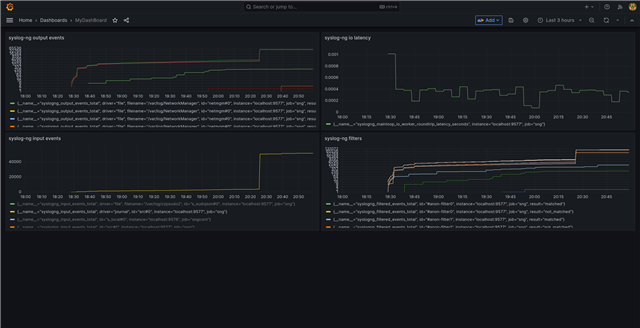
-
If you have questions or comments related to syslog-ng, do not hesitate to contact us. You can reach us by email or even chat with us. For a list of possibilities, check our GitHub page under the “Community” section at https://github.com/syslog-ng/syslog-ng. On Twitter, I am available as @PCzanik, on Mastodon as @Pczanik@fosstodon.org.