

This is the 12th part of my syslog-ng tutorial. Last time, we learned about enriching log messages using syslog-ng. Today, we learn about how to send log messages to Elasticsearch.
You can watch the video or read the text below.
History of Elasticsearch support
Originally, the Elasticsearch destination of syslog-ng was implemented in Java. It was a bit resource hungry, but it worked well and was also fast. Unfortunately, however, this implementation could not be included in Linux distributions, as the build process used tools that were unavailable in distributions and downloaded JAR files instead of compiling everything from the source. Using Java was also problematic, because the included drivers had to be updated after each Elasticsearch release.
As such, there is now another implementation of the Elasticsearch destination that does not need Java. Actually, it is a configuration snippet in the syslog-ng configuration library (SCL). It is a wrapper around the generic http() destination driver, which is implemented in C. It is not just the Elasticsearch destination that uses it, though: Slack, Sumologic, Telegram, and a number of other destinations all build on the http() destination.
Note that while I keep referring to this driver as “Elasticsearch destination”, you can actually use it with several other software utilizing the Elasticsearch API, such as Opensearch, Zinc, Humio and probably more.
Elasticsearch-http()
In this part of the syslog-ng tutorial, we use a configuration similar to what we used when we talked about log enrichment. However, there are a few changes. The first one is that instead of a JSON file, syslog-ng sends log messages to Elasticsearch. Here you can see an Elasticsearch destination, based on the elasticsearch-http() driver:
destination d_elasticsearch_http {
  elasticsearch-http(
    index("syslog-ng")
    type("")
    user("elastic")
    password("Gr3CmhxxxxxxuCWB")
    url("https://localhost:9200/_bulk")
    template("$(format-json --scope rfc5424 --scope dot-nv-pairs
      --rekey .* --shift 1 --scope nv-pairs
      --exclude DATE @timestamp=${ISODATE})")
    tls(peer-verify(no))
  );
};
There might be minor differences in the URL or template when sending logs to Opensearch, Zinc or Humio. You can find configuration examples in the syslog-ng blog.
The index() is the database name where syslog-ng sends the log messages. Type() was used for Elasticsearch 6 and earlier. It is still a mandatory parameter for the driver in syslog-ng, but for 7 and later versions, you have to keep this parameter empty. User() and password() identify the user if security is enabled. URL() takes multiple parameters, and that way, syslog-ng can perform load balancing among multiple Elasticsearch nodes.
The template is almost the same as we have seen in the previous part of my syslog-ng tutorial. We talked about templates and template functions earlier, so here I only want to emphasize one key difference: there are no new lines at the end of the template. While new lines make text files easier to read, they break Elasticsearch.
GeoIP rewrite
The GeoIP parser of syslog-ng stores longitude and latitude information into two separate name-value pairs. Kibana expects them in a single name-value pair and does not like empty values. As such, this rewrite rule makes sure that syslog-ng sends geographical location information in the expected format, and only if the related information exists.
rewrite r_geoip2 {
  set(
    "${geoip2.location.latitude},${geoip2.location.longitude}",
    value( "geoip2.location2" ),
    condition(not "${geoip2.location.latitude}" == "")
  );
};
Mapping
For certain data types, like geographical coordinates, Elasticsearch needs mapping. Mapping is telling Elasticsearch that a given name-value pair contains a certain data type. This mapping matches the example syslog-ng configuration in this tutorial, and sets the type to “geo_point”.
Note that mapping has slight differences between the various Elasticsearch versions, so the following example might need small modifications for the version you use.
{
  "mappings" : {
    "properties" : {
      "geoip2" : {
        "properties" : {
          "location2" : {
            "type" : "geo_point"
          }
        }
      }
    }
  }
}
Example configuration
This example configuration collects both local log messages and iptables logs over the network. It parses the iptables logs, and adds geographical information to source IP addresses using the GeoIP parser. Finally, it stores both the local log messages and the parsed iptables logs into Elasticsearch.
@version:3.37
@include "scl.conf"
source s_sys { system(); internal();};
destination d_mesg { file("/var/log/messages"); };
log { source(s_sys); destination(d_mesg); };
source s_tcp {
  tcp(ip("0.0.0.0") port("514"));
};

parser p_kv {kv-parser(prefix("kv.")); };

parser p_geoip2 { geoip2( "${kv.SRC}", prefix( "geoip2." ) database( "/usr/share/GeoIP/GeoLite2-City.mmdb" ) ); };

rewrite r_geoip2 {
    set(
        "${geoip2.location.latitude},${geoip2.location.longitude}",
        value( "geoip2.location2" ),
        condition(not "${geoip2.location.latitude}" == "")
    );
};

destination d_elasticsearch_http {
    elasticsearch-http(
        index("syslog-ng")
        type("")
        user("elastic")
        password("Gr3CmhxxxxxxuCWB")
        url("https://localhost:9200/_bulk")
        template("$(format-json --scope rfc5424 --scope dot-nv-pairs
        --rekey .* --shift 1 --scope nv-pairs
        --exclude DATE @timestamp=${ISODATE})")
        tls(peer-verify(no))
    );
};


log {
    source(s_sys);
    source(s_tcp);
    if (match("s_tcp" value("SOURCE"))) {
        parser(p_kv);
        parser(p_geoip2);
        rewrite(r_geoip2);
    };
    destination(d_elasticsearch_http);
    flags(flow-control);
};
As usual, the configuration starts with a version number declaration and including the syslog-ng configuration library. It is followed by a source for local log messages, a file destination, and a log statement, which connects the two together.
Iptables log messages are collected by a tcp() source. These logs are first parsed by a key=value parser, then by the GeoIP parser. You can learn more about these in the previous part of my tutorial.
The rewrite rule creates a new name-value pair by combining the longitude and latitude information if they are not empty. The resulting format complies with the expectations of Elasticsearch and Kibana.
The elasticsearch-http() destination stores log messages into an Elasticsearch database.
The log statement starts with two sources: one for the local log messages, while the other one is the network source for collecting iptables logs. Parsing is only necessary for logs arriving to the network source, so there is an if statement, which is matching on logs coming from the TCP source. Matching logs are parsed and rewritten by the parsers and the rewrite rule defined earlier. Finally, all log messages are sent to Elasticsearch.
Flags(flow-control) at the end means that if the destination is slow, syslog-ng slows down receiving the log messages. This works with a TCP source or when reading a file. However, it does not work with UDP, as syslog-ng has no way of letting the sending side know that the message rate is too high.
Iptables sample logs
Here are some iptables sample logs. These are good enough for testing, however using some real-life iptables log messages are a lot more fun. Refer to the previous part of the tutorial on how to send these logs to syslog-ng.
Feb 27 14:31:01 bridge kernel: INBOUND UDP: IN=br0 PHYSIN=eth0 OUT=br0 PHYSOUT=eth1 SRC=212.123.153.188 DST=11.11.11.82 LEN=404 TOS=0x00 PREC=0x00 TTL=114 ID=19973 PROTO=UDP SPT=4429 DPT=1434 LEN=384
Feb 27 14:34:41 bridge kernel: INBOUND TCP: IN=br0 PHYSIN=eth0 OUT=br0 PHYSOUT=eth1 SRC=206.130.246.2 DST=11.11.11.100 LEN=40 TOS=0x00 PREC=0x00 TTL=51 ID=9492 DF PROTO=TCP SPT=2577 DPT=80 WINDOW=17520 RES=0x00 ACK FIN URGP=0
Feb 27 14:34:55 bridge kernel: INBOUND TCP: IN=br0 PHYSIN=eth0 OUT=br0 PHYSOUT=eth1 SRC=4.60.2.210 DST=11.11.11.83 LEN=48 TOS=0x00 PREC=0x00 TTL=113 ID=3024 DF PROTO=TCP SPT=3124 DPT=80 WINDOW=64240 RES=0x00 SYN URGP=0
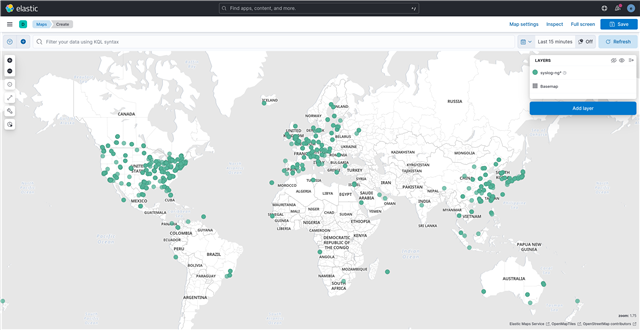
IP addresses on map using GeoIP and Kibana
This maps shows IP addresses on a map. It was created with syslog-ng using the GeoIP parser to turn IP addresses into geographical locations. Then, I used Kibana for display.
Talking to security professionals, I was advised that these maps do not have much practical value. However, people in upper management love visualizations, and showing maps based on your firewall logs might help you to get additional funding for your information security budget… :-)
If you have any questions or comments, leave a comment on YouTube or reach out to me on Twitter / Mastodon.
-
If you have questions or comments related to syslog-ng, do not hesitate to contact us. You can reach us by email or even chat with us. For a list of possibilities, check our GitHub page under the “Community” section at https://github.com/syslog-ng/syslog-ng. On Twitter, I am available as @PCzanik, on Mastodon as @Pczanik@fosstodon.org.-