

Version 7 of the Elastic stack was released a few months ago, and brought several breaking changes that affect syslog-ng. In my previous blog post, I gave details about how it affects sending GeoIP information to Elasticsearch. From this blog post you can learn about the Kibana side, which has also changed considerably compared to previous releases. Configuration files for syslog-ng are included, but not explained in depth, as that was already done in previous posts.
Note: I use a Turris Omnia as log source. Recent software updates made the Elasticsearch destination of syslog-ng available on the Turris Omnia. On the other hand, you might be following my blog without having access to this wonderful ARM Linux-based device. In the configuration examples below, Turris Omnia does not send logs directly to Elasticsearch, but to another syslog-ng instance (running on the same host as Elasticsearch) instead. This way you can easily replace Turris Omnia with a different device or loggen in your tests.
Before you begin
First of all, you need some iptables log messages. In my case, I used the logs from my Turris Omnia router. If you do not have iptables logs at hand, several sample logs are available on the Internet. For example, you can take Anton Chuvakin’s Bundle 2 ( http://log-sharing.dreamhosters.com/ ) and use loggen to feed it to syslog-ng.
Then, you also need a recent version of syslog-ng. The elasticsearch-http() destination was introduced in syslog-ng OSE version 3.21.1 (and PE version 7.0.14).
Last but not least, you will also need Elasticsearch and Kibana installed. I used version 7.3.0 of the Elastic Stack, but any version after 7.0.0 should be fine. Using version 7.1.0 (or later) has the added benefit of having basic security built in for free: neither payment nor installing 3rd party extensions are necessary.
Network test
It is easy to run into obstacles when collecting logs over the network. Routing, firewalls, SELinux can all prevent you from receiving (and sometimes even sending) log messages. This is the reason why it is worth doing an extra step and test collecting logs over the network. Before configuring Elasticsearch and Kibana, make sure that syslog-ng can actually receive those log messages.
Below is a very simple configuration to receive legacy syslog messages over TCP on port 514 and store them in a file under /var/log. Append it to your syslog-ng.conf, or place it in its own file under the /etc/syslog-ng/conf.d/ directory if your system is configured to use it.
# network source
source s_net {
    tcp(ip("0.0.0.0") port("514"));
};

# debug output to file
destination d_file {
     file("/var/log/this_is_a_test");
};

# combining all of above in a log statement
log {
    source(s_net);
    destination(d_file);
};
Once syslog-ng is reloaded, it listens for log messages on port 514 and stores any incoming message to a file called /var/log/this_is_a_test. Below is a simple configuration file for the Turris Omnia, sending iptables logs to the port opened above. Store it in a separate file under the /etc/syslog-ng.d/ directory. You can also test logging using logger (a basic utility to send syslog messages) or loggen (a utility bundled with syslog-ng to send syslog messages for testing and benchmarking).
destination d_net {
    network("192.168.1.187" port(514));
};

log {
    source(kernel);
    filter(f_iptables);
    destination(d_net);
};
Once syslog-ng is restarted on the Turris Omnia, you should see incoming log messages on your syslog-ng server. Iptables on my router logs an unwanted packet almost every second, so normally you do not have to wait long to see messages in the /var/log/this_is_a_test file.
Configuring Kibana
Starting with version 7 of the Elastic stack, you need to configure mapping before sending data (that is, logs) to an index. Therefore, once you tested that iptables logs arrive to your syslog-ng server, it is time to configure Kibana.
It is assumed that you have a freshly installed Kibana and Elasticsearch and you do not yet have any data in it. Configurations in this blog post use ‘syslog-ng’ for index name. If you already have an index with this name, you should use a different name while following the rest of instructions from this blog.
By default, Kibana only listens on localhost. If Kibana is running on a different host, make sure that you edit /etc/kibana/kibana.yml, uncomment the server.host setting and change it to 0.0.0.0 or a specific remotely accessible IP address or hostname.
Once you have changed the configuration, restart Kibana. After a few seconds you can connect to Kibana on port 5601. The initial screen offers to populate Elasticsearch with some sample data (Try our sample data). While that option is good for learning, now choose “Explore on my own” instead.

Next, Kibana brings you to the regular opening screen. On first run, it asks if you want to send some usage data to Elastic. Respond based on your and/or your company’s preferences.
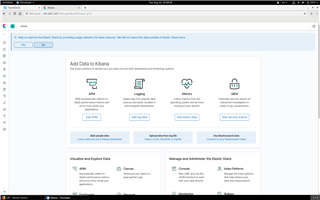
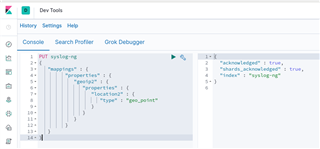
You can see some icons on the left hand side of the screen. Choose the third one from below (shaped like a spanner) to setup mapping. It brings you to the development tools and opens up a console.
Replace the content of the window on the left with data to set up syslog-ng GeoIP mapping in Elasticsearch:
PUT syslog-ng
{
   "mappings" : {
         "properties" : {
            "geoip2" : {
               "properties" : {
                  "location2" : {
                     "type" : "geo_point"
                  }
               }
            }
         }
   }
}
Click the small green triangle pointing to the right (in the upper right corner, next to the spanner-shaped icon) to actually execute the API call. Once you clicked on it, you should see the response from Elasticsearch as shown below.
Routing your logs to Elasticsearch
Now that mapping is configured for Elasticsearch, it is time to route your log messages to Elasticsearch. The configuration below was broken down in depth in previous blogs, so only the main points are described here:
-
It collects both local log messages (source s_sys, you might need to change the name to reflect your environment).
-
Logs arriving over the s_tcp source are parsed by the key-value parser and the geoip2 parsers. Geographical information is rewritten to be suitable for Elasticsearch.
-
Finally, all logs are stored to Elasticsearch.
If you used a different name, you might need to change the index name in the elasticsearch-http() destination.
source s_tcp {
  tcp(ip("0.0.0.0") port("514"));
};

parser p_kv {kv-parser(prefix("kv.")); };

parser p_geoip2 { geoip2( "${kv.SRC}", prefix( "geoip2." ) database( "/usr/share/GeoIP/GeoLite2-City.mmdb" ) ); };

rewrite r_geoip2 {
    set(
        "${geoip2.location.latitude},${geoip2.location.longitude}",
        value( "geoip2.location2" ),
        condition(not "${geoip2.location.latitude}" == "")
    );
};

destination d_elasticsearch_http {
    elasticsearch-http(
        index("syslog-ng")
        type("")
        url("http://localhost:9200/_bulk")
        template("$(format-json --scope rfc5424 --scope dot-nv-pairs
        --rekey .* --shift 1 --scope nv-pairs
        --exclude DATE --key ISODATE @timestamp=${ISODATE})")
    );
};


log {
    source(s_sys);
    source(s_tcp);
    if (match("s_tcp" value("SOURCE"))) {
        parser(p_kv);
        parser(p_geoip2);
        rewrite(r_geoip2);
    };
    destination(d_elasticsearch_http);
    flags(flow-control);
};
Reload syslog-ng for the configuration to take effect.
Configuring the index
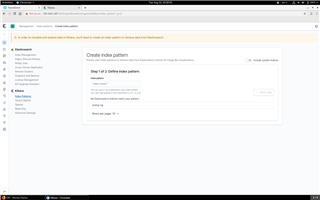
Now that you have mapping configured and logs forwarded to Elasticsearch as well, it is time to configure the index in Kibana.
Normally when you click on the compass icon in Kibana, it takes you to the search interface. However, the first time you click there, you do not have an index configured in Kibana yet, so it takes you to the “Create index pattern” screen. Enter “syslog-ng*” here as index pattern and click “Next step”.
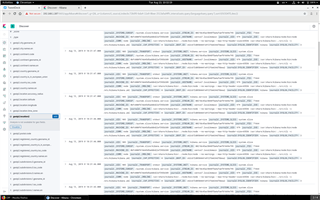
On the second screen, select ISODATE from the drop-down list and click on “Create index pattern” to finish configuration. It will bring to the search interface and display some messages from the previous 15 minutes. If you take a look at the left hand side, you will see a long list of names(the names of name-value pairs as sent by syslog-ng, including GeoIP data).
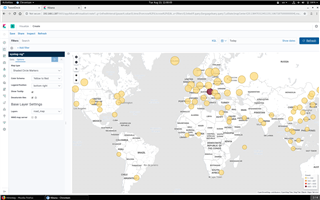
If you click on “geoip2.location2”, a button called “Visualize” will appear below the name. Click on the “Visualize” button. The screen below shows a visualization of connection attempts collected in just a few minutes to my home router sitting in a quiet residential area of Budapest.
Now you can do basic search and visualization of your log data in Kibana. For in-depth tutorials on how to use Kibana, check the documentation at https://www.elastic.co/guide/en/kibana/current/index.html . To learn more about the Elasticsearch destination of syslog-ng, check the documentation at https://www.syslog-ng.com/technical-documents/doc/syslog-ng-open-source-edition/3.22/administration-guide/32#TOPIC-1209188
If you have questions or comments related to syslog-ng, do not hesitate to contact us. You can reach us by email or even chat with us. For a list of possibilities, check our GitHub page under the “Community” section at https://github.com/balabit/syslog-ng. On Twitter, I am available as @PCzanik.