

For quite some time, Splunk has recommended to collect syslog messages using syslog-ng, save them to files, and send them to Splunk using forwarders. Unless you have a very high message rate, the HTTP destination of syslog-ng can greatly simplify this logging architecture. Instead of writing messages to files and reading them by a forwarder, syslog-ng can forward messages to Spunk HTTP Event Collector (HEC) directly, using HTTP or HTTPS connections. And if you parse messages using syslog-ng, you can send the resulting name-value pairs to Splunk in JSON format and be able to search them instantly.
Before you begin
For my tests, I used the latest available releases of Splunk and syslog-ng running on CentOS 7. I used Splunk 7.0.1 and syslog-ng 3.13.1. You do not have to run the latest and greatest, as HEC was already available in Splunk 6.x and the HTTP destination is available in syslog-ng from version 3.7, with encryption (HTTPS) added in 3.10.
Note that the HTTP destination is usually not part of the core syslog-ng package. On CentOS, it is in a sub-package called syslog-ng-http. The name may vary in other distributions.
For simplicity, I use unencrypted connections, but unless syslog-ng and Splunk are running on the same machine, you’d better enable SSL.
Enable HEC in Splunk
In order to receive messages over HTTP, you need to enable the HTTP Event Collector in Splunk.
Log in as administrator, and choose Settings > Data inputs > HTTP Event Collector. In the upper right corner, click Global Settings. Here, click Enable and remove the check mark from Enable SSL. If you modify an already existing Splunk installation, make any further site-specific changes as necessary.
Sending syslog messages as is
The easiest way to use the HTTP destination is to send syslog messages as is, without any modifications. This might also be a requirement by some of the Splunk applications which expect unmodified syslog messages.
Setting up a token in Splunk
Splunk needs a token in log messages to figure out their format and intended destination. You can create one by going to the HEC page in Splunk and clicking the New Token button in the upper right corner.
First, give the token a name. On the next screen, select the “syslog” source type. At the end of the process, you will see a token similar to this: 94476318-fc2c-410b-a9a8-5796585ffc9e. Make a note of it as you will need it in the syslog-ng configuration. Keep this tab open, you will need it later on.
Configuring syslog-ng
You can append the configuration snippet below to the end of your current syslog-ng configuration, or create a new .conf file under /etc/syslog-ng/conf.d/ if this possibility is enabled in your distribution.
destination d_http1 {
    http(url("http://localhost:8088/services/collector/raw")
        method("POST")
        user_agent("syslog-ng")
        user("user")
        password("94476318-fc2c-410b-a9a8-5796585ffc9e")
        body("${ISODATE} ${HOST} ${MSGHDR}${MESSAGE}")
    );
};
log { source(s_sys); destination(d_http1); };
The above configuration assumes that Splunk is running on localhost and that you have a source called “s_sys” (name of local log sources on CentOS). You should replace the value of the password() parameter with the token you just generated, and modify any other parameters as necessary.
Testing
Once you restarted syslog-ng, you are ready for testing. Enter the following command in a shell running on the same machine as syslog-ng:
logger This is a test
If you kept the token setup window open, you can now select the Search & Report button there, and it will bring you right to the search interface, narrowing your searches to the new token. Otherwise, start the search application and search for your test message.
Sending parsed messages in JSON format
The syslog-ng application can parse log messages using the built-in parsers. The parsers help you to locate interesting information in log messages and create name-value pairs from them. You can use the name-value pairs to filter log messages and/or to make data available for searching and dashboards.
You can forward parsed values to Splunk HEC in JSON format. This enables you to do more precise searches: instead of trying to locate information in free-form text, you can search the extracted name-value pairs.
Setting up a token in Splunk
Splunk needs a token in log messages to figure out their format and intended destination. You can create one by going to the HEC page in Splunk and clicking the New Token button in the upper right corner.
First, give the token a name. On the next screen, select the “_JSON” source type. At the end of the process, you will see a token similar to this: 1d5f30bb-d9ed-4933-9430-0cd17e9857b6. Make a note of it as you will need it in the syslog-ng configuration. Keep this tab open, you will need it later on.
Configuring syslog-ng
You can append the configuration snippet below to the end of your current syslog-ng configuration, or create a new .conf file under /etc/syslog-ng/conf.d/ if this possibility is enabled in your distribution.
destination d_http2 {
    http(url("http://localhost:8088/services/collector/raw")
        method("POST")
        user_agent("syslog-ng")
        user("user")
        password("1d5f30bb-d9ed-4933-9430-0cd17e9857b6")
        body("$(format-json --scope all-nv-pairs)")
    );
};
parser p_patterndb {
  db-parser(
    file("/etc/syslog-ng/sshd.pdb")
  );
};
log {
  source(s_sys);
  parser(p_patterndb);
  destination(d_http2);
};
The above configuration assumes that Splunk is running on localhost and that you have a source called “s_sys” (name of local log sources on CentOS). You should replace the value of the password() parameter with the token you just generated, and modify any other parameters as necessary.
Compared to the previous configuration, you can notice two changes here:
- We are using the format-json template function to create a JSON formatted message.
- We added a patterndb parser (XML database downloaded from https://github.com/balabit/syslog-ng-patterndb).
Testing
Once you restarted syslog-ng, you are ready for testing. Try to connect to the machine running syslog-ng using ssh a few times, and check the logs.
If you kept the token setup window open, you can now select the Search & Report button there, and it will bring you right to the search interface, narrowing your searches to the new token. Otherwise, start the search application and search for sshd messages.
You should see a similar JSON-formatted message on screen:
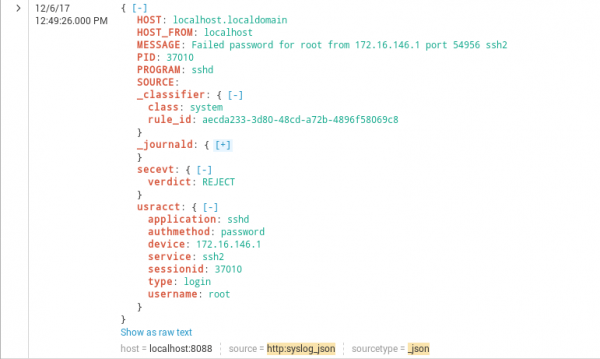
At the top, you can see the original syslog fields. “_classifier” is added by the patterndb parser just as “secevt” and “usracct”. The fields coming from journald are not expanded here to save space, but practically they are the syslog fields repeated and a few additional fields.
If you want to search for all the rejected connections, search for:
sourcetype="_json" | spath "secevt.verdict" | search "secevt.verdict"=REJECT
You can learn more about the HTTP destination at https://www.syslog-ng.com/technical-documents/doc/syslog-ng-open-source-edition/3.16/administration-guide
