

One of the most popular applications to feed Splunk with syslog messages is syslog-ng. However not everyone is happy to work on the command line anymore. This is where syslog-ng store box (SSB), an appliance built around syslog-ng, can help. The SSB GUI provides you not only with an easy-to-use interface to configure most syslog-ng features, but also a search interface and complete log life cycle management. It can forward log messages to several destinations, recently also to Splunk’s HTTP Event Collector (HEC).
From this blog you can learn about how SSB fits into your logging infrastructure and how to configure SSB for Splunk.
Optimizing logging for SIEM & analysis
For many years syslog and syslog-ng were the final destinations of log messages. Logs were collected in a central syslog server, stored as text files and processed using grep and awk. Later an SQL destination was added, so various database tools could be used to analyze log messages. As time passed, there was an increasing number of log analysis tools available and in use. And often multiple of these tools were in use, as different departments were looking for different information in logs. Some of the SIEM and analysis tools started to provide their own tools for log collection, however using multiple tools for the same task is inefficient. This is how the dedicated log management layer was born.
When you have a dedicated log management layer, there is no need to install a separate log collector for each of your SIEM or log analysis software. Logs are collected by a single software and shipped to a central location. Logs can be parsed and filtered, stored there for long term archival and forwarded to several different SIEM and log analysis software. This makes both software installation and configuration easier and can save you significant amount of bandwidth. These can save you resources already in an on-premises installation, but even more relevant in a cloud-based environment where you pay extra for any resource utilization.
Why SSB?
The syslog-ng store box is a perfect central server of your log management layer. Its GUI hides the complexity of configuring syslog-ng and provides you with many additional possibilities.
Various log analysis tools usually need a small subset of your log data. Your SIEM needs authentication related events, your inventory app needs hardware related logs while your sales team needs web server access logs. Often, they can only deal with small amount of log messages and store them for a limited amount of time. On the SSB web interface you can easily configure the destination of different logs, now with a possibility to forward logs to Splunk HEC.
However, there are situations when these logs need to be viewed together, long after they were deleted from their target software. This is where the additional possibilities of SSB can help you. SSB can retain log messages much longer than your various analysis tools. SSB not only stores the logs but also indexes them and provides you with an easy-to-use search interface. This helps you achieve compliance with various regulations requiring long term archival, and facilitates quick problem solving.
You can use SSB to collect log messages from any kind of software supporting one of the syslog protocols. However, purchasing SSB gives you access to using syslog-ng Premium Edition (PE) on the client side. This opens up additional possibilities, like Windows support or more reliable message delivery.
Splunk users relied on syslog-ng for collecting syslog messages for a very long time by now. Originally, syslog-ng stored log messages as text files and a Splunk forwarder forwarded the logs to Splunk. However, this solution increased the complexity of log management. With the introduction of HEC in Splunk, syslog-ng can forward log messages directly to Splunk without additional software. And now SSB also provides you with a Splunk HEC destination.
Configuring Splunk
Before you configure SSB, you have to configure Splunk. I do not want to provide you with a step-by-step guide here, as some of the details might change over time. You can find the main steps below:
First, you have to enable the HTTP event collector. You can find it under Settings – Data inputs. It is disabled by default and it can be enabled under Global Settings.
Now you should generate a new token. From the syslog-ng point of view the two important data here are the name of the index and the token at the end. These are used to configure SSB.
You should also note down the IP address or host name of your Splunk server.
Configuring SSB
Configuring the SSB side has two major steps. First, you have to create a new destination for Splunk and then use this destination in a log path (the part of the configuration, which connects log sources to destinations). For simplicity, I add the freshly created Splunk destination to log path which is created by default: connecting all the default network sources to a logspace called Center.
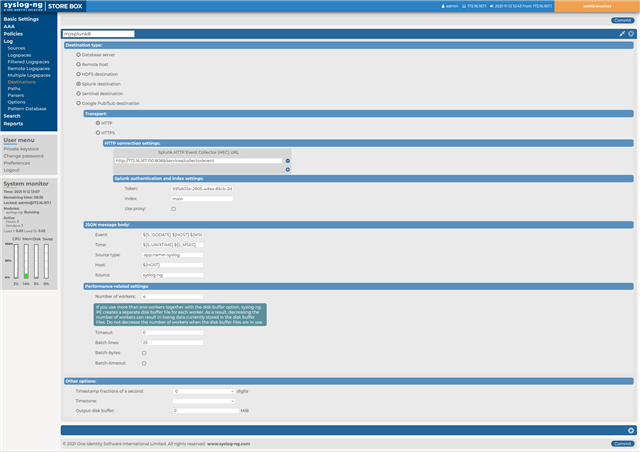
The first step is creating a Splunk destination. In the upper left corner choose Log and then Destinations. Create a new destination by clicking the + sign close to the upper right corner of the screen. Give it a name, which you can later use to refer to it in other parts of the configuration. Use Splunk as destination type. For testing I used simple HTTP, for production use I recommend using HTTPS. Now enter the URL for the HEC. It should be something similar, just replace the IP address to the actual IP address or host name on your network: http://172.16.167.150:8088/services/collector/event I do not have multiple Splunk instances on my network, but you can add multiple HEC instances here, and SSB will round robin log messages among them. The next mandatory settings are the Token and the Index. You should use the same values you used in the Splunk configuration. With these settings you are ready to go, so commit them. The rest of the settings help you to fine tune the content of log messages and performance. Read the documentation for details.
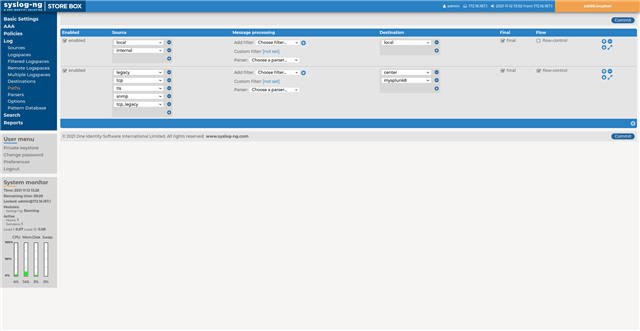
Finally, you should add the freshly created Splunk destination to a log path. In a production environment you will most likely create a dedicated log path with its own filters and other settings. Here I simply add it to an existing log path available right after installation. It connects the network sources enabled by default to a logspace called Center. Right below destinations you can find paths in the upper left menu. We modify the second path. It is a really simple change compared to configuring the destination. Just find the Center destination, click on + on the line below and select your Splunk destination from the drop-down list. Commit the changes and you are ready for testing!
Testing
To test your freshly configured environment, you can use the logger utility to send log messages from the command line to SSB and the log message should automatically show up in Splunk as well. The exact syntax of the logger utility varies on different platform. This command works on CentOS 8:
logger -n 172.16.167.147 -P 514 -T --rfc3164 öt szép szűzleány őrült írót nyúz
Replace the IP address with the IP or hostname of your SSB. You can also replace the test message to something specific to your environment. I use this Hungarian sentence to test if all the accented characters work. You should see the test message both in SSB and in Splunk.
What is next?
I hope that this quick introduction to SSB and Splunk was able to whet your appetite and you will try SSB with Splunk yourself. You can download SSB and ask for a trial license on the syslog-ng website. The syslog-ng store box product page is available at https://www.syslog-ng.com/products/log-management-appliance/