

Intro
Anytime a new language binding is introduced to syslog-ng, somebody immediately implements an Elasticsearch destination. There is one in Lua, Perl and Python, meaning that there is a very strong interest in getting data from syslog-ng into Elasticsearch. With the introduction of Java destination in syslog-ng two years ago, the official Elasticsearch destination driver was also released by the syslog-ng team, developed in Java.
This is the third blog post in a six-part series on storing logs in Elasticsearch using syslog-ng. You’ll find a link to the next and previous parts in the series at the end of this post. You can also read the whole Elasticsearch series in a single white paper.
Why do so many people want to send their logs to Elasticsearch? There are many reasons:
- it is an easy-to-scale and easy-to-search data store
- it is NoSQL: any number of name-value pairs can be stored (Hello PatternDB!)
- Kibana: an easy-to-use data explorer and visualization solution for Elasticsearch
And why to use syslog-ng on the sending side? There are also very good reasons for that:
- A single, high-performance and reliable log collector for all of your logs, no matter if they are coming from network devices, local system or applications. Therefore, it can greatly simplify your logging architecture.
- High speed data processor, parsing both structured (JSON, CSV/click stream) and unstructured log messages (PatternDB). It can also anonymize log messages if required by policies or regulations, and reformat them to be easily digested by analyzers.
- Complex filtering, to make sure that only important messages get through and they reach the right destination.
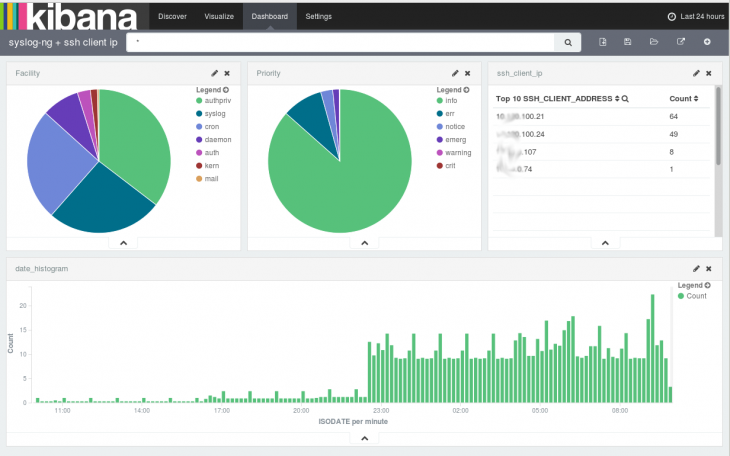
The next screenshot shows a Kibana dashboard, which displays logs collected by syslog-ng, parsed by PatternDB and stored into Elasticsearch by our Java-based driver:
You might ask, why Java, when it is usually not as resource-efficient as something developed in C. The simple answer is that while there are client libraries implemented in dozens of languages, there is not one written in C. The official Elasticsearch client is implemented in Java and developed together with the server component. The core of syslog-ng remains in C, it can efficiently collect, process and filter logs just as until now. There is a small, syslog-ng-specific Java code that can utilize the official Elasticsearch client JAR files to connect to Elasticsearch clusters. This ensures full compatibility even with a quickly changing Elasticsearch now and also in the future.
Getting started
If you would like to use the Elasticsearch destination, you can use any recent syslog-ng version. For syslog-ng Premium Edition, the latest version is 7.0 and all the information to get started is included in the documentation at https://support.oneidentity.com/technical-documents/syslog-ng-premium-edition/7.0.9/administration-guide. For the Open Source Editon, 3.9.1 is the current version. Java support is not yet included in the syslog-ng packages available as part of the different Linux distributions due to lack of required JAR files and a build tool (Gradle). Fortunately there are 3rd party repositories for several Linux distributions (Debian, Fedora, openSUSE and many of their derivatives), which have Java support enabled. You can find them at https://www.syslog-ng.com/products/open-source-log-management/3rd-party-binaries.aspx
This approach worked fine for version 1.X and 2.X of Elasticsearch. For version 5.X you can use the freshly introduced HTTP mode for connection, which also can connect to earlier Elasticsearch versions making transition between different versions easier.
Configuring syslog-ng
Once all the prerequisites are met, you can continue with configuring syslog-ng. The next example is the relevant part of a syslog-ng.conf. You might need to change directory names and other parameters to better fit your system:
######
# network sources
source s_net {
  udp();
  tcp();
  syslog();
};

######
# patterndb parser
parser pattern_db {
  db-parser(
    file("/opt/syslog-ng/etc/patterndb.xml")
  );
};

######
# Elasticsearch destination
destination d_es {
  elasticsearch2 (
    cluster("syslog-ng")
    client_mode("http")
    index("syslog-ng")
    type("test")
    template("$(format-json --scope rfc5424 --scope nv-pairs --exclude DATE --key ISODATE)")
  )
};

######
# sending logs to ES destination
log {
  source(s_net);
  source(s_local);
  parser(pattern_db);
  destination(d_es);
  flags(flow-control);
};
Unless you want to store logs from a single machine in Elasticsearch, you will have to declare a network source, where you can collect logs from remote machines. Source “s_net” collects legacy syslog messages on port 514 through both UDP and TCP protocols, and RFC5424 syslog messages on port 601. If you want to use other ports, encryption or any other parameters, read the “Collecting log messages” section of the syslog-ng Administrator Guide.
I have already mentioned in the introduction, that Elasticsearch is a NoSQL database and can store any number of different name-value pairs. Basic syslog data can easily be stored in SQL databases, but syslog-ng can parse messages and create name-value pairs based on message content. There are parsers for JSON-formatted messages and columnar data, like CSV files or Apache access logs, but the most interesting one is PatternDB, a radix tree-based parser in syslog-ng, which can parse unstructured logs at extreme speed, without the performance penalties of regexp-based parsers. On the above screenshot you can see results from parsing SSH login messages: PatternDB-created name-value pairs, which contain the source IP address of the logged in user.
There are some sample patterns available on GitHub at https://github.com/balabit/syslog-ng-patterndb and you can read more about creating new patterns in the “Processing message content with a pattern database” chapter of the syslog-ng Administrator Guide. For this example, I have used https://github.com/balabit/syslog-ng-patterndb/blob/master/access/sshd.pdb.
The next section in the cited configuration is about configuring the Elasticsearch destination. It is a Java destination configured to load the Elasticsearch drivers. The included example is for connecting to Elasticsearch in HTTP mode. For a simple test you only have to change the cluster name. Read the documentation about the differences between connection modes and a detailed description of parameters. If you also store production data in your Elasticsearch cluster, secure the connection with encryption: https://www.syslog-ng.com/community/b/blog/posts/secure-your-elasticsearch-cluster-and-avoid-ransomware.
Finally, all of the previously mentioned components are glued together by a log statement. There are two extra parameters: “source(s_local)” stands for the logs collected on the local machine and might be called something completely different in your base syslog-ng.conf file. The other one is about flow control. This is an optional mechanism in syslog-ng, which slows down reading from sources (not possible for UDP) when the destination is not fast enough. It is described in the “Managing incoming and outgoing messages with flow-control” section of the syslog-ng Administrator Guide.
Configuring Kibana
Once you have configured syslog-ng to store logs into Elasticsearch, it is time to configure Kibana. Starting with version 4.0 it is a standalone server application. You might have to configure the elasticsearch_url variable, if Kibana is installed to a separate machine (by default it searches for Elasticsearch on localhost). When you first access it, the web interface requires you to configure an index pattern. The index name should be “syslog-ng_*”, and the time field name “ISODATE”, if you use the above configuration.
The “Discover” is the first screen to appear after configuration. You should be able to see the messages sent by syslog-ng.
Even if it takes a few minutes and a few megabytes of extra storage space, I would recommend you to follow the “Getting started” tutorial from the Kibana documentation now. There is some sample data to download and load into your Elasticsearch cluster and a few exercises that demonstrate the basic functionality of Kibana: https://www.elastic.co/guide/en/kibana/current/index.html.
Next steps
I hope you find this information useful to get started. I have already provided several pointers in the documentation that should cover most aspects on the syslog-ng side. Getting started with Elasticsearch is as easy as installing a package on a single machine and starting it. On the other hand, if you want to use it in production, you should definitely read the Elasticsearch documentation as well about clustering, removing old logs, performance tuning and so on.
If you have any questions, or would like to report a problem, you can reach us through the following:
- the syslog-ng mailing list: https://lists.balabit.hu/mailman/listinfo/syslog-ng
- the source code of syslog-ng is on GitHub: https://github.com/balabit/syslog-ng where you can also report issues
- on IRC the #syslog-ng channel on Freenode
- for commercial support check the Premium Edition website at https://www.syslog-ng.com/products/log-management-software/
In my next Elasticsearch blog, I provide step-by-step guidance about how to get started on RHEL/CentOS using syslog-ng in combination with Elasticsearch 5 and Elasticsearch 6.
In my previous blogs in the Elasticsearch series, I covered:
- Basic information about using Elasticsearch with syslog-ng and how syslog-ng can simplify your logging architecture
- Logging to Elasticsearch made simple with syslog-ng
Read the entire series about storing logs in Elasticsearch using syslog-ng in a single white paper.
Update
This blog was originally written about syslog-ng 3.7.1 and Elasticsearch 1.6. It was updated to syslog-ng 3.9.1. Also, now it contains information about Elasticsearch 2.X and 5.X including HTTP mode.