

The hook-commands() option of syslog-ng makes it easy to execute external commands when a driver is started or stopped. For example, you can open a port in the firewall when a network source is started and close it once syslog-ng is shut down. Or you could also run a command each time syslog-ng is reloaded. From this blog, you can learn how to start and stop auditing file system changes using auditctl from syslog-ng, then collect, parse and filter the results, and finally send them to Elasticsearch for storage and further analysis.
Before you begin
For writing this blog, I used the latest version of CentOS 7 with all updates running syslog-ng 3.16 and Elasticsearch 6.3. On the other hand, anything I write here should work just fine on other distributions, too. You can use older versions of Elasticsearch and syslog-ng, as long as the version you are using supports the Linux audit parser and HTTP mode connection to Elasticsearch (version 3.10+). To make my life easier, I disabled SELinux and firewalld: this is good for testing but not recommended in a production environment.
Once you installed all required components, it is time to configure them. The syslog-ng configuration below expects that the Elasticsearch cluster is called “syslog-ng”. Either configure Elasticsearch accordingly or change the cluster name in the syslog-ng configuration. There are no other changes from the default Elasticsearch and Kibana installations.
Configuring syslog-ng
Create a configuration file for syslog-ng. A base configuration is already in place. On CentOS and on most recent Linux distributions, you can extend the base configuration by creating a file under /etc/syslog-ng/conf.d with a .conf extension.
Collecting audit logs
Using auditd on Linux, you can audit many different events happening on your system. User space applications, like sshd can forward authentication-related events to auditd. And using auditctl, you can also enable auditing events in the kernel. This can be used, for example, to track any changes under the /etc directory, holding vital configuration for your Linux system.
Audit logs can take up a substantial amount of storage space, so it is better to enable kernel-level tracking only when these logs are actively processed and acted upon. Using the hook-commands option of syslog-ng, you can enable accounting when the reading of the audit log starts and disable it when syslog-ng is stopped.
source s_auditd {

  file("/var/log/audit/audit.log" flags(no-parse)

    hook-commands(

      startup("auditctl -w /etc/ -p wa")

      shutdown("auditctl -W /etc/ -p wa")

    )

  );

};
Parsing messages
The Linux audit parser in syslog-ng can create name-value pairs from the audit log, making it easier to search and report on the collected data.
If you take a look at the value of msg in audit logs – including SSH-related audit logs – you often see that it is a collection of key=value pairs. If you parse this field further using the kv-parser, you gain additional important name-value pairs about events on your servers.
parser p_auditd {

    linux-audit-parser (prefix("auditd."));

    kv-parser (template("${auditd.msg}") prefix("amsg."));

};
Filtering messages
On a busy server, audit.log contains an overwhelming amount of information. Assuming that you manage your server over SSH, you can easily filter your logs to only contain messages relevant for you: SSH logs and path auditing logs. Who was logged in and which files changed.
filter f_ssh {

  "${amsg.terminal}" eq "ssh"

};


filter f_path {

  "${auditd.type}" eq "PATH"

};


filter f_ssh_or_path {

  filter(f_ssh) or filter(f_path)

};
Elasticsearch destination
Using a document store – like Elasticsearch – you can save arbitrary name-value pairs and easily search and report on them. In our case, these name-value pairs are the ones created by the linux-audit-parser and the kv-parser. As I already mentioned earlier, the below configuration assumes that the cluster name is “syslog-ng”. Check the syslog-ng documentation for a complete list of Elasticsearch destination options.
destination d_elastic {

  elasticsearch2 (

    cluster("syslog-ng")

    client_mode("http")

    index("syslog-ng")

    type("test")

    template("$(format-json --scope rfc5424 --scope nv-pairs --exclude DATE --key ISODATE)")

  )

};


Connecting building blocks together

The final part of the log statement binds all of the above configuration parts together: the source, the parser, the filter, and the destination.

log {

  source(s_auditd);

  parser(p_auditd);

  filter(f_ssh_or_path);

  destination(d_elastic);

};
Complete configuration
And here is the complete configuration to make copy & paste easier for you:
source s_auditd {

  file("/var/log/audit/audit.log" flags(no-parse)

    hook-commands(

      startup("auditctl -w /etc/ -p wa")

      shutdown("auditctl -W /etc/ -p wa")

    )

  );

};


parser p_auditd {

    linux-audit-parser (prefix("auditd."));

    kv-parser (template("${auditd.msg}") prefix("amsg."));

};


filter f_ssh {

  "${amsg.terminal}" eq "ssh"

};


filter f_path {

  "${auditd.type}" eq "PATH"

};


filter f_ssh_or_path {

  filter(f_ssh) or filter(f_path)

};


destination d_elastic {

  elasticsearch2 (

    cluster("syslog-ng")

    client_mode("http")

    index("syslog-ng")

    type("test")

    template("$(format-json --scope rfc5424 --scope nv-pairs --exclude DATE --key ISODATE)")

  )

};


log {

  source(s_auditd);

  parser(p_auditd);

  filter(f_ssh_or_path);

  destination(d_elastic);

};
Testing
Once you configured syslog-ng, restart it for the configuration to take effect:
systemctl restart syslog-ng
Now you are ready to generate some logs for auditd:
- Log in to your system using SSH.
- Change a user’s password or simply create, modify and delete a file under the /etc directory. For example:
echo bla > /etc/bla

echo blabla >> /etc/bla

rm /etc/bla
You can now open Kibana on port 5601 of your machine. The first time you open Kibana, you also have to set it up:
- First you have to enter an index name. Using the above syslog-ng configuration, it is “syslog-ng”.
- Next, choose “ISODATE” for the “Time filter field name”.
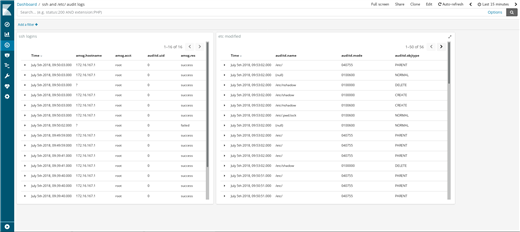
You are now ready to browse your logs. While direct correlation of path audit and SSH logins is not possible, you can at least check from where users logged in while a suspicious configuration change happened. With a bit of extra work, you can even create a dashboard in Kibana where you can follow both SSH logins and configuration changes on screen.
If you have questions or comments related to syslog-ng, do not hesitate to contact us. You can reach us by email or you can even chat with us. For a list of possibilities, check our GitHub page under the “Community” section at https://github.com/balabit/syslog-ng. On Twitter, I am available as @PCzanik.
