

Talking to syslog-ng users, I found that many of them plan to take a closer look at Grafana, due to the upheaval around the change of licensing terms for Elastic. Luckily, it is now possible to jump-start the complete, new logging stack – including Grafana, Loki, syslog-ng and tools to monitor this stack – with a single command. All you need to do is to point a couple of syslog clients at the included syslog-ng server and open Grafana in your browser. Of course, this setup is far from being production-ready, but it can speed up preparing a test environment for you.
From this blog, you can learn how to install Grafana, Loki, syslog-ng stack, how to forward your log messages there, and how to check the results in Grafana.
The configurations and Docker compose files of this stack were prepared by Dave Schmid, who is known on GitHub as lux4rd0.
A similar environment is also available for Elasticsearch: https://www.syslog-ng.com/community/b/blog/posts/jump-starting-esk-elasticsearch-syslog-ng-and-kibana
Before you begin
As you could guess from the introduction, you need to run Docker and the docker-compose command to install this logging stack. I used it on openSUSE Leap 15.2 as a base operating system, but any Linux distribution with a recent-enough Docker and the docker-compose command should work. You also need at least two hosts to send logs to the syslog-ng server and one of them can be the host running Docker.
Getting started
There is no installation in a traditional sense. You just download a set of Docker compose files and configurations from GitHub and then you can start the environment. You do not even need Git to do this:
wget https://github.com/lux4rd0/grafana-loki-syslog-aio/archive/main.zip
unzip main.zip
cd grafana-loki-syslog-aio-main
The included README contains a few hints how to secure the environment, but for now, just go ahead with starting the environment. Using Docker compose makes the whole thing a lot less painful: it sets up all the different containers, maps configuration files, and configures networking. All you need is a single command to start the environment:
docker-compose -f ./docker-compose.yml up -d
Depending on your network connections, the whole environment is ready for testing within a few minutes. You can open port 3000 of the host and be greeted by the Grafana dashboard. The only problem is that it is empty.
Configuring log sources
Of course, without logs, even the fanciest dashboard is of not much use at all. So, configure a few hosts to forward their log messages to the syslog-ng server running as part of this stack. One of those could be the host running Docker. Just add this to your syslog-ng configuration and reload syslog-ng:
destination d_grafana {
  udp("127.0.0.1" port(514));
};
log {
  source(src);
  destination(d_grafana);
};
Of course, the name of the source might be different in your setup, `src` is the default name for local logs in syslog-ng.conf on SLES and openSUSE. Use the same configuration on at least one more machine, but replace localhost with the external IP of the host running the Grafana/Loki/syslog-ng stack.
Testing
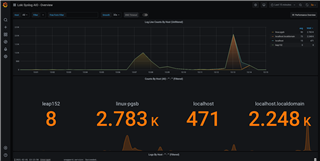
Now, that you have at least two systems forwarding logs to your new logging stack, you are ready for testing. Open Grafana in a browser (port 3000 of the host, where you ran docker-compose) and look around. You should see incoming logs from the systems that you configured to send logs. It should look something similar:
When you scroll down, you can browse the logs. You can also search the logs. It is probably not as fast as Elasticsearch/Kibana, but it also uses a lot less resources.
Best of all, by default, the docker-compose also starts Prometheus. It collects all kinds of metrics about Grafana and the host running the Grafana stack. You can reach the dashboards from the drop-down menu in the upper right corner. While metrics do not provide much useful information in my small test environment, they can help you monitor your setup and provide you with enough data for sizing your production environment.
If you have questions or comments related to syslog-ng, do not hesitate to contact us. You can reach us by email or even chat with us. For a list of possibilities, check our GitHub page under the “Community” section at https://github.com/syslog-ng/syslog-ng. On Twitter, I am available as @Pczanik.