
Getting data to Splunk can be challenging. Syslog is still the most important data source, and it can provide you with hard-to-solve problems (for example, like high volume, non-compliant messages, unreliable network protocol (UDP), and more). The syslog-ng Premium Edition (PE) and syslog-ng Store Box (SSB) by One Identity can make these challenges manageable.
Why syslog-ng?
Splunk ingests data using indexers. Sending log data from hosts directly to indexers is considered bad practice, as it is easy to overload individual indexers with log data. You can use network load-balancers to share the load among indexers, but they do not deal with the message content.
You can also use syslog-ng to collect log messages and then Splunk Universal Forwarders (UF) to feed the indexers. However, this method adds additional complexity to the system and its performance is rather low. In this scenario, syslog-ng is used for log collection. It writes log messages into files in a directory structure and Splunk UF forwards log messages to the indexers.
The most efficient and highest performance solution is leaving both log collection and forwarding to syslog-ng. Both syslog-ng PE and SSB can send log messages to the Splunk HTTP Event Collector (HEC) using their splunk-hec() destinations, and its built-in load-balancer can distribute the load among multiple indexers.
A single syslog-ng instance can handle hundreds of thousands of log messages. Best of all: this syslog-ng instance is not limited to feed incoming log messages to Splunk indexers. It can archive log messages for long term storage and filter messages, so only relevant messages reach Splunk. Also, it can feed multiple log analytics systems if one of your departments uses a different software.
A simple syslog-ng PE splunk-hec() configuration
It is not our goal here to deep-dive into the syslog-ng configuration. The following configuration example shows you a simple syslog-ng PE configuration. It collects log messages using the unreliable UDP protocol, discards some of the log messages, and finally forwards them to Splunk.
@version: 7.0
@include "scl.conf"
source s_net {
    udp-balancer(
    listeners(8)
    port(514));
};
destination d_splunk_hec {
     splunk-hec(
     index("main")
     token("fcddc233-a7f4-43eb-903a-0654625c5803")
     url("http://your-splunk-server:8088/services/collector/event") );
};
filter f_program { not program('proftpd');};
filter f_nodebug { level(info..emerg);};
log {
    source(s_net);
    filter(f_program);
    filter(f_nodebug);
    destination(d_splunk_hec);
};
As you can see, the configuration starts with a version declaration and the syslog-ng configuration library (a collection of configuration snippets) is included. Various configuration blocks define the source, the destination, and the filters. These configuration blocks are connected using a log statement.
Of course, the splunk-hec() destination has many more options available, as you can see in this slightly more complex configuration:
destination d_splunk_hec {
    splunk-hec(
        url("https://192.168.38.72:8088/services/collector/event")
        index("main")
        sourcetype("_json")
        token("fcddc233-a7f4-43eb-903a-0654625c5803")
        delimiter("\n")
        time("$S_UNIXTIME.$S_MSEC")
        host("$HOST")
        event("$(format-json  --key event --scope nv-pairs --key .SDATA.* --shift 1 .SDATA.meta.* --shift-levels 2 --scope core --key ISODATE )\n")
        disk-buffer( mem-buf-length(10000) disk-buf-size(2000000) reliable(no) dir("/var/disk-buffer") )
        tls(peer-verify(no))
        batch-lines(100)
        batch-bytes(512Kb)
        batch-timeout(10000)
        timeout(10));
};
You can configure the template of the message using the event() parameter a disk-buffer to hold the messages while Splunk is unavailable due to maintenance or network problems, and various batching-related options to fine tune performance. For a complete list of options and their parameters, check the documentation.
Filtering
One of the most important features of syslog-ng from the Splunk point of view is filtering. What is filtering? Basically, selecting log messages. Filtering can be used to discard log messages, like throwing away debug level log messages. It is also used for message routing, for example, making sure that all authentication related messages reach your SIEM.
Reducing Splunk licensing costs is just part of the picture. Splunk is licensed based on the amount of ingested log messages: sending only relevant logs means lower Splunk licensing costs. However, it also reduces overall operational costs: less hardware is needed for processing, less storage, less operating system licenses, less maintenance costs over the years.
Filters can come in several different forms:
A filter can compare macro (name-value pairs, parsed from log messages) values. This one checks for empty process ID fields.
filter f_pid {"${PID}" !=""};
There are also quite a few filter functions. This one checks if the level of the syslog message is set between “error” and “emergency”:
filter f_levels { level(err..emerg) };
Filters can also do pattern matching. The following filter checks the content of the HOST macro:
filter host_match { match('dbrsvr-\d{2,5}', value("HOST")); };
Best of all: you can combine filters using Boolean operators:
filter f_demo1 { host("example") and match("deny") value("MESSAGE")); };
This allows some very complex filtering rules, making sure that you forward all relevant log messages to Splunk, but only those. You can see filters in use in the sample configuration above.
Minimize UDP event loss
You can minimize UDP event loss using syslog-ng in multiple ways. One is using relays as close to the source as possible. The other one is using the udp-balancer() source of syslog-ng PE.
Using relays is a best practice in any larger syslog-ng deployment. But what are relays? Instead of sending logs directly to the central syslog-ng servers, you can create additional layer(s) between the clients and the central server. Relays do not save incoming log messages, but forward them either to the next relay or to the central server instead.
You should use relays if you have multiple physical locations or larger deployments. Relays ensure logs are collected even if the central server is unavailable due to networking problems or maintenance. You can also distribute log processing using relays.
Relays are especially important when you still have UDP log sources. UDP is unreliable and the farther away you collect logs from the source, the greater chance of the message loss. So, you should use relays as close to UDP sources as possible, and forward log messages using more reliable protocols.
If you have a low volume UDP message source, placing a relay next to the source is good enough precaution. However, when you have high volume UDP message sources, you should use the udp-balancer() source of syslog-ng PE. Using the udp-balancer() syslog-ng PE is not limited to a single UDP listener, and incoming log messages are distributed evenly among listeners.
We have already seen a simple configuration earlier, here you can find a more complex udp-balancer() sample configuration:
source s_udp_bsd-514_lb {
      udp-balancer(
        listeners(8)
        port(514)
        so-rcvbuf(16777216)
        log-fetch-limit(20000)
        log-iw-size(30000));
};
You can find more information about the various parameters in the syslog-ng PE documentation.
SSB splunk-hec configuration
SSB is an appliance with syslog-ng PE at its heart. SSB does not support all of the syslog-ng PE features on its web interface, but in return, it is ready to use a few minutes after you turn it on. It provides not just GUI to syslog-ng, but full log life cycle management, and lightning fast search even in terabytes of log messages.
Configuring the Splunk destination only takes a few clicks:
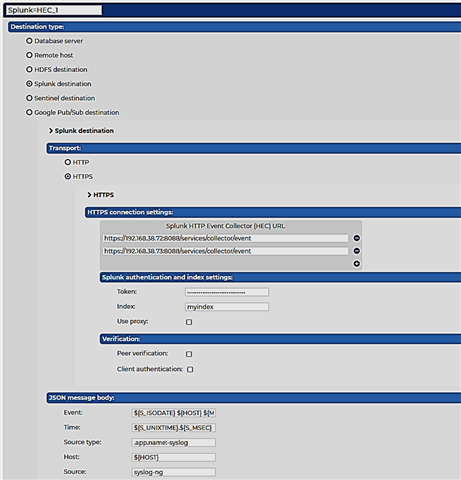
You also receive syslog-ng PE clients and relays when you buy SSB, so you can install relays to remote locations, and ensure low UDP event loss.
What is next?
For more details, watch the syslog-ng Technical Splunk Use-Case Webcast. It provides you not just with more details, but also shows some future possibilities with Splunk and SSB: searching the SSB appliance from Splunk.